How Your Leave - PTO - Flexibility Benefits Compare to Other Employers

Flexibility Isn’t a Perk Anymore — It’s an Expectation
Employee expectations around flexibility and time off have changed dramatically over the past few years. What was once considered a competitive perk is now a baseline expectation, and organizations that haven’t revisited their leave strategy may be falling behind without realizing it.
Yet one of the most common gaps we see when working with employers isn’t what they offer — it’s that they don’t actually know how their leave benefits compare to peers.
Benchmarking provides that clarity. It helps organizations understand where they stand, identify gaps, and make intentional, data-informed decisions that support retention, engagement, and long-term workforce sustainability.
What the Data Says: Leave Benefits Benchmarking Highlights
Current benchmarking data reveals meaningful trends in how employers structure leave and flexibility benefits.
Core Leave Benefits
Across organizations:
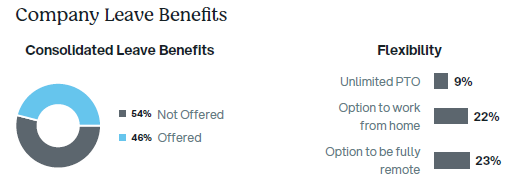
- 46% offer consolidated leave
- 76% offer paid vacation
- 79% offer paid holidays
- 81% offer paid sick leave
- The average number of paid holidays offered is 8 days
While many employers offer some form of paid leave, how that leave is structured can significantly impact the employee experience.
Consolidated vs. Non‑Consolidated Leave: Why Structure Matters
Consolidated leave policies often provide employees with more flexibility and clarity — and the difference becomes more noticeable over time.
Benchmarking shows that organizations with consolidated leave provide, on average:
- 14 days after 1 year of service
- 20 days after 5 years of service
- 20 days after 10 years of service
- 23 days after 20 years of service
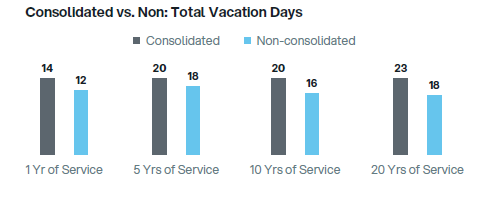
Non‑consolidated plans consistently offer fewer total vacation days at each tenure milestone. Over the course of an employee’s career, those differences can meaningfully influence satisfaction, loyalty, and burnout risk.
Workplace Flexibility: Still Less Common Than Expected
Despite flexibility being a top driver of engagement and retention, benchmarking data shows it is far from universal:
- Only 9% of employers offer unlimited PTO
- 22% offer an option to work from home
- 23% allow employees to be fully remote
These numbers often surprise leadership teams — particularly given how frequently flexibility is cited as a priority by employees.
Carryover Policies & Additional Leave Benefits
Leave policies don’t stop at vacation days. Carryover rules and supplemental benefits also play a critical role in how employees experience time off.
Sick Leave Carryover
- 64% of employers allow sick day carryover
- Only 20% allow unlimited carryover
Other Leave Benefits Offered
- 87% offer unpaid family leave
- 67% offer paid family leave
- 50% offer paid personal leave
- 36% offer paid military leave
- 64% offer jury duty pay
- 59% offer paid funeral leave
The variability across these benefits highlights why benchmarking is so valuable — two organizations may both “offer leave,” yet deliver very different employee experiences.
The Bigger Question Employers Should Be Asking
The real value of benchmarking isn’t about keeping up with the market or copying competitors.
It’s about asking:
- Do our leave benefits align with our culture and values?
- Are we supporting employee well‑being — or unintentionally contributing to burnout?
- Does our leave strategy support retention at key career stages?
- Are we making decisions based on assumptions, or on data?
Without benchmarking, these questions are difficult to answer with confidence.
Using Benchmarking to Make Better Decisions
Effective benchmarking helps organizations:
- Identify gaps between intention and reality
- Prioritize benefits that matter most to employees
- Support engagement, retention, and performance
- Build a leave strategy that evolves with workforce expectations
Flexibility and leave benefits are no longer secondary considerations — they are foundational to a people‑centered workforce strategy.
If you don’t know where your organization stands today, benchmarking is the first step toward building a more intentional and competitive benefits program.
To learn more about how Innovative Benefit Planning helps employers benchmark smarter and make data‑driven benefits decisions, visit: https://www.ibpllc.com/benchmarking/